Analytics
Read the overview, compare periods, and see messages, campaigns, leads and team.
1 min video9 stepsEnglish and हिंदी
Language
Step by step
The same steps in writing, with a screenshot for each.
1. The overview
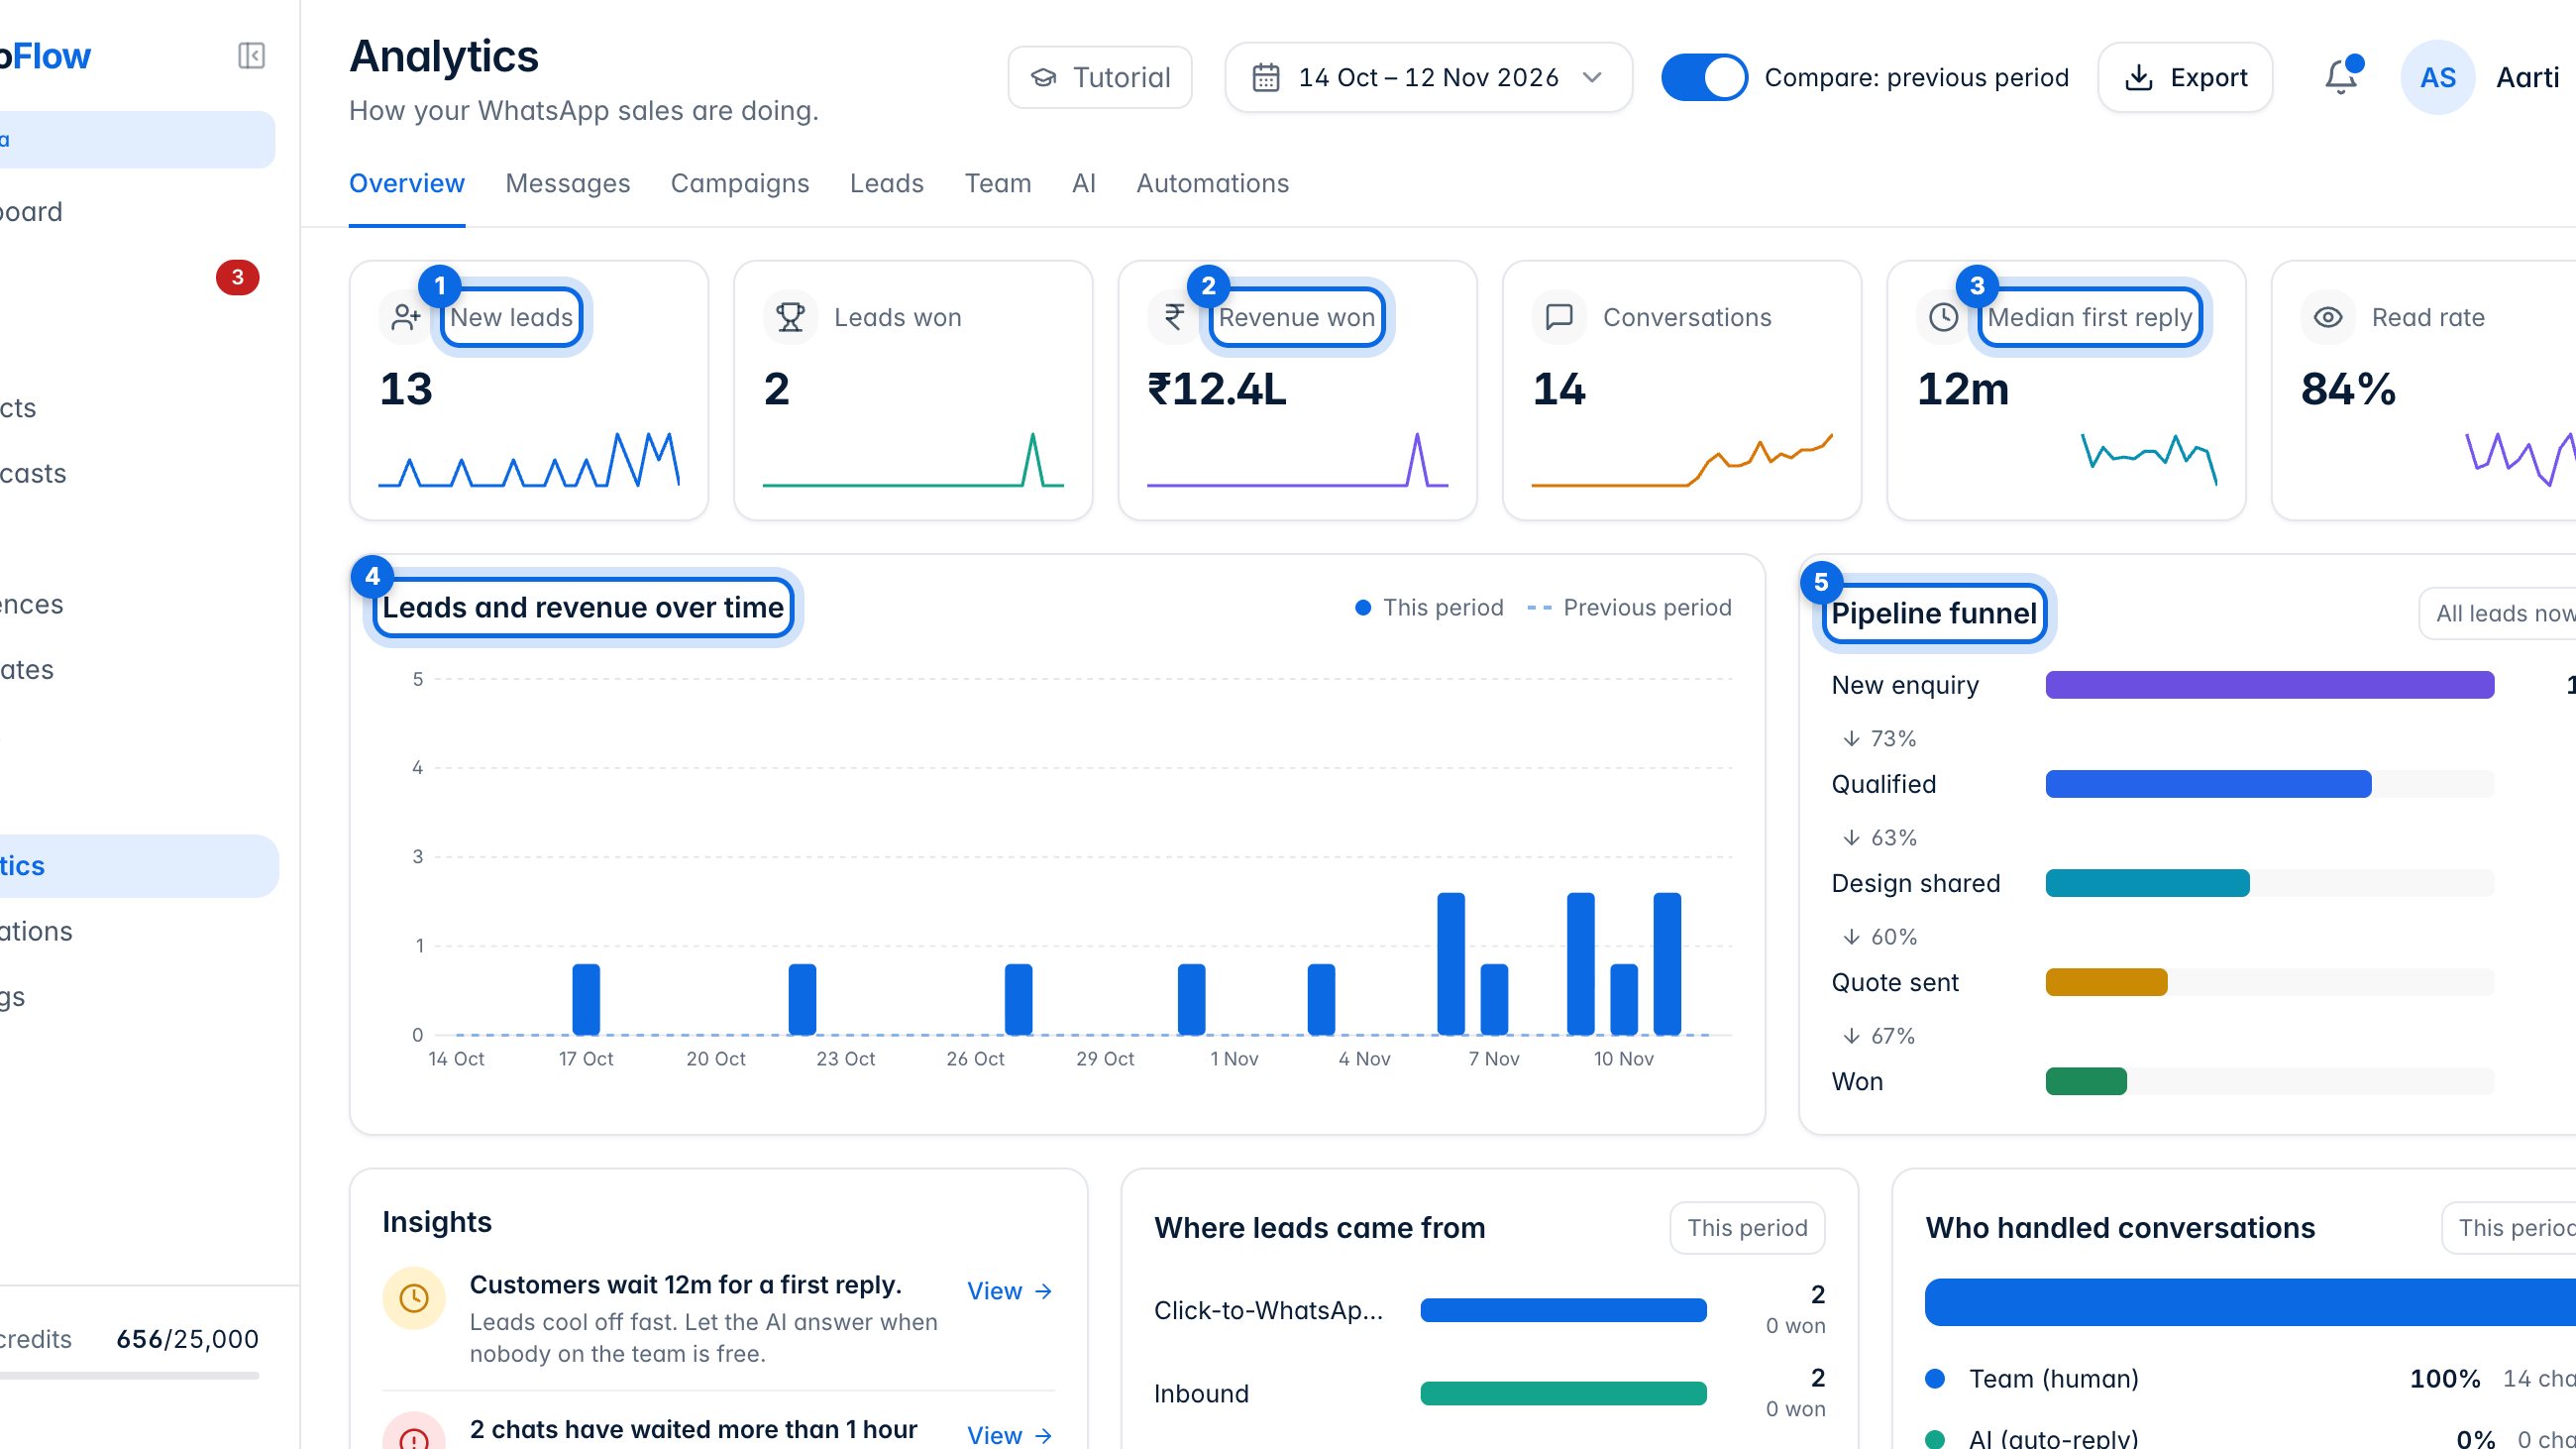
The top row sums up the period: new leads (1), revenue won (2), how quickly your team first replies (3), and more. The chart (4) shows leads and revenue day by day, and the funnel (5) shows how many leads reach each stage.
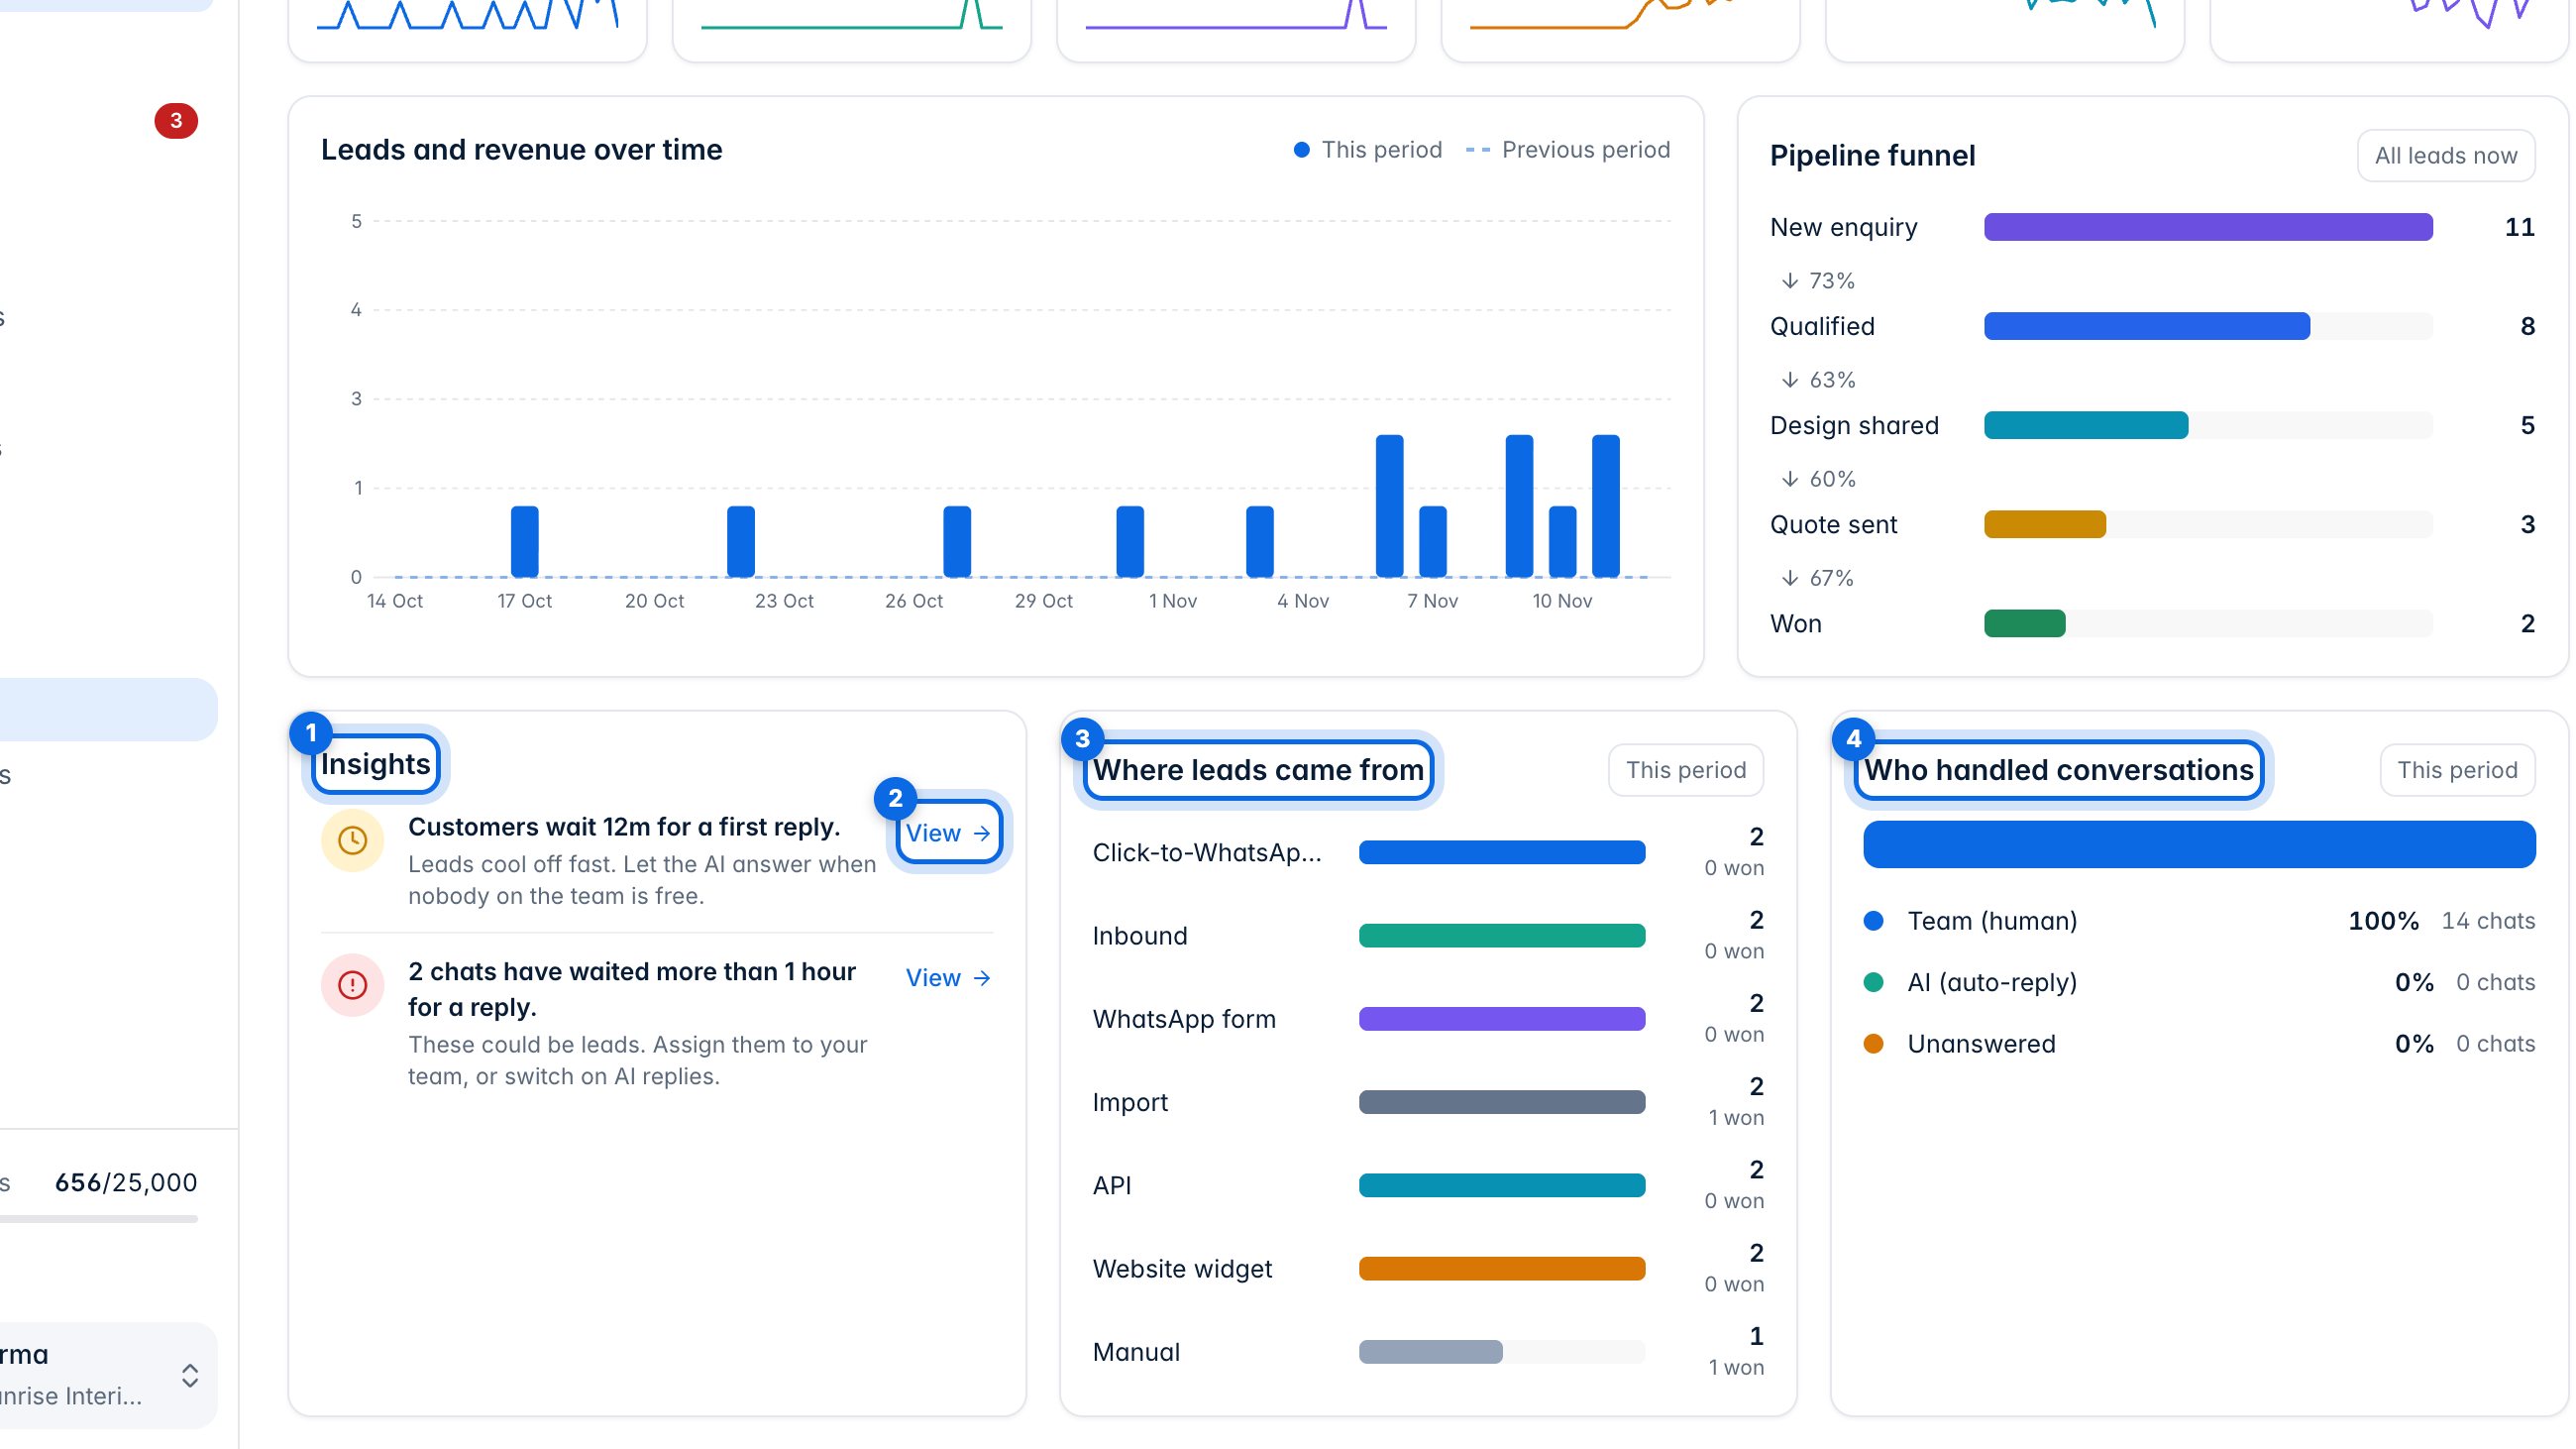
Insights (1) point out what needs attention, and View (2) takes you there. Below, see where leads came from (3) and who handled conversations (4): your team, the AI, or nobody yet.
2. Period, compare and export
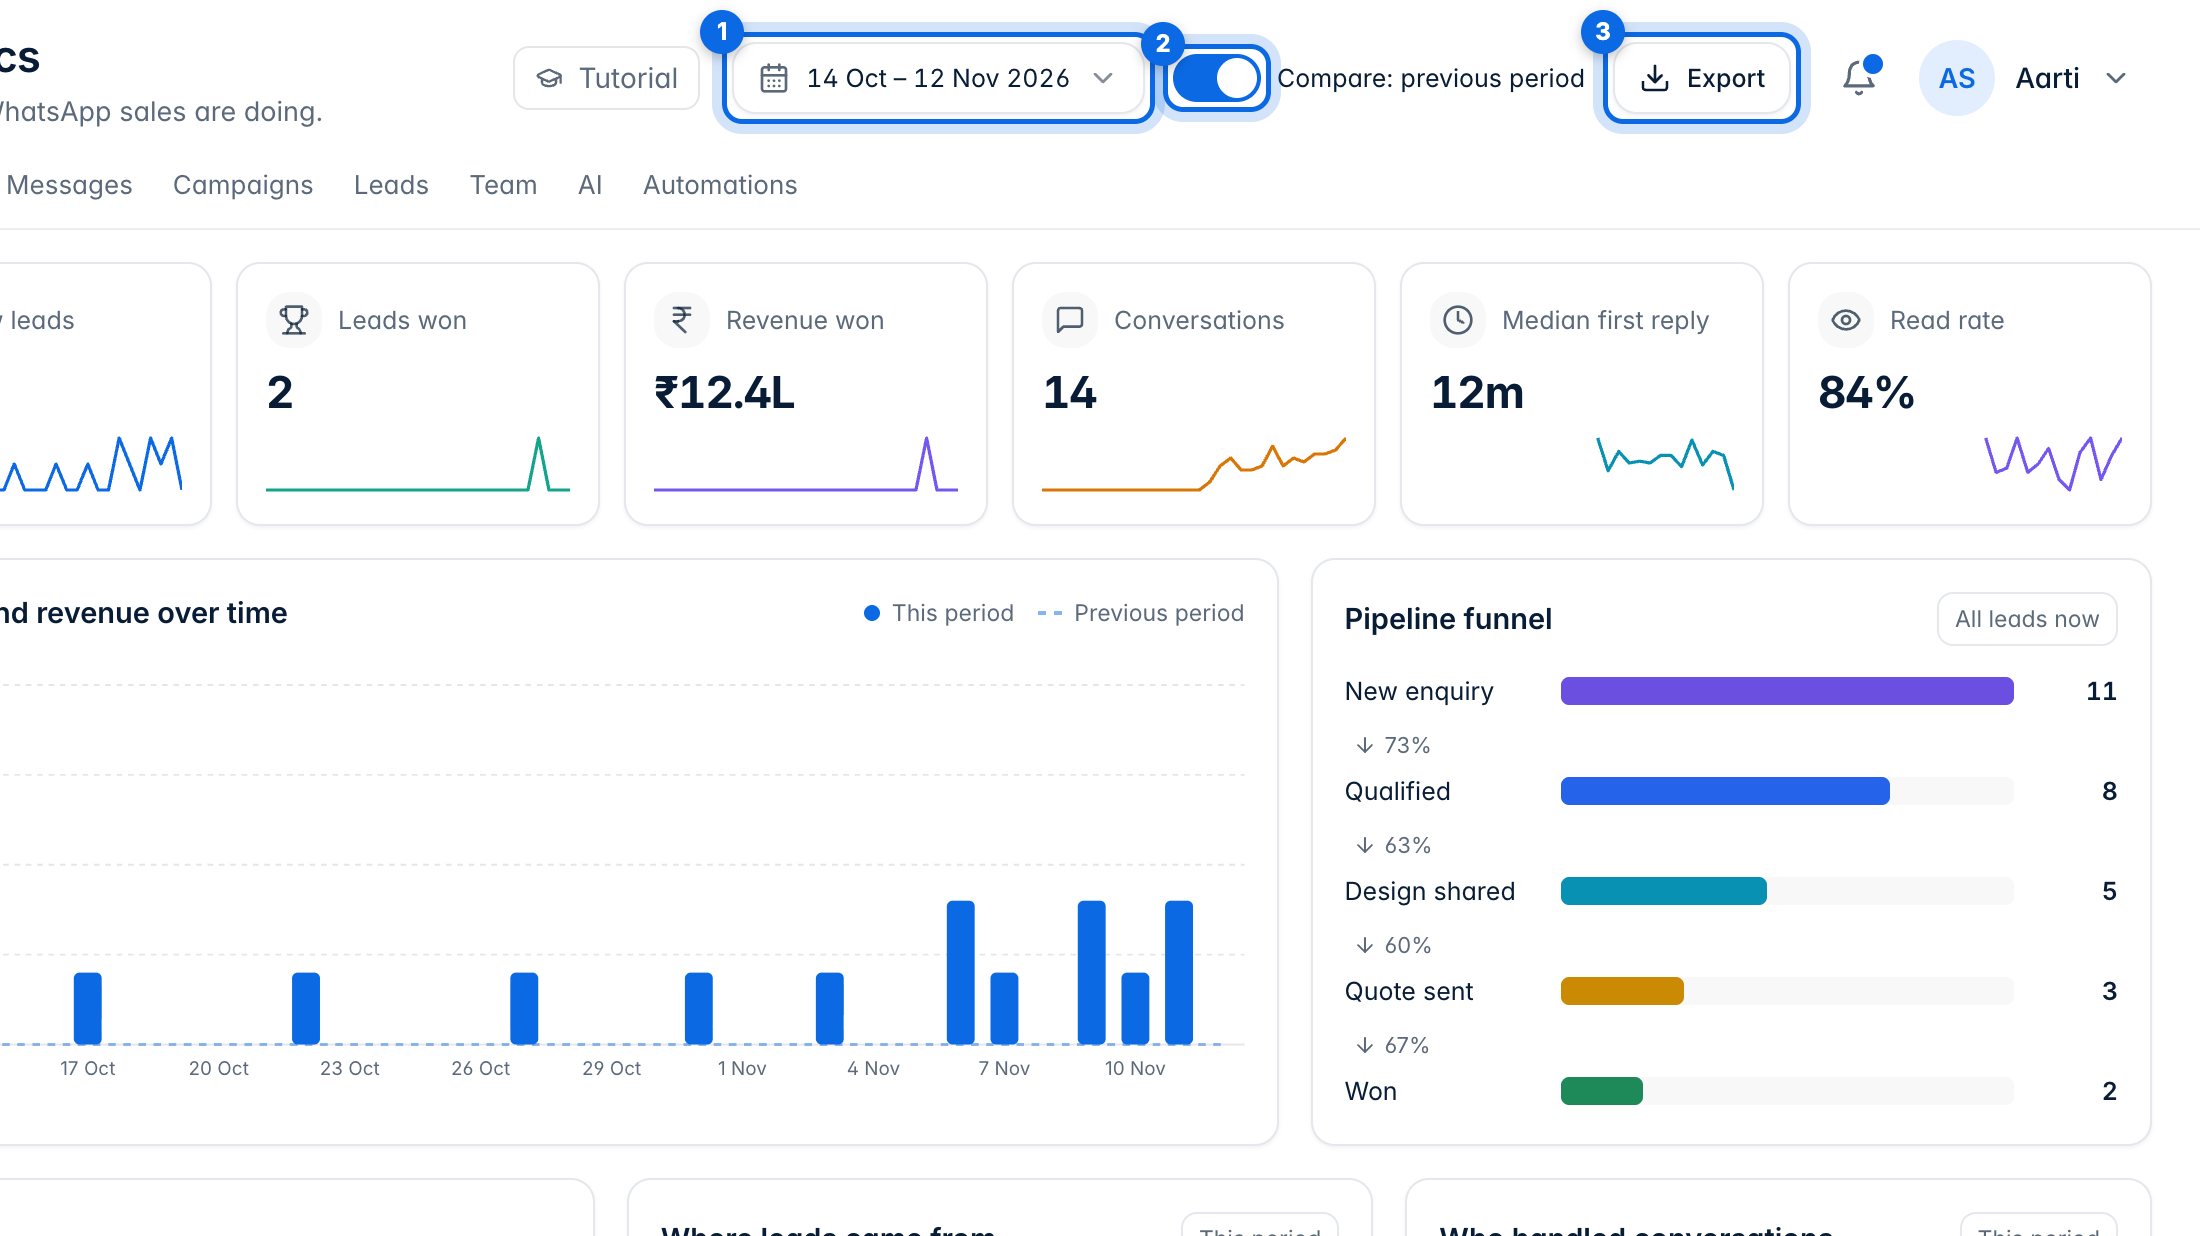
Choose the last 7, 30 or 90 days (1). Compare (2) shows the period before it alongside. Export (3) downloads the numbers as a CSV file.
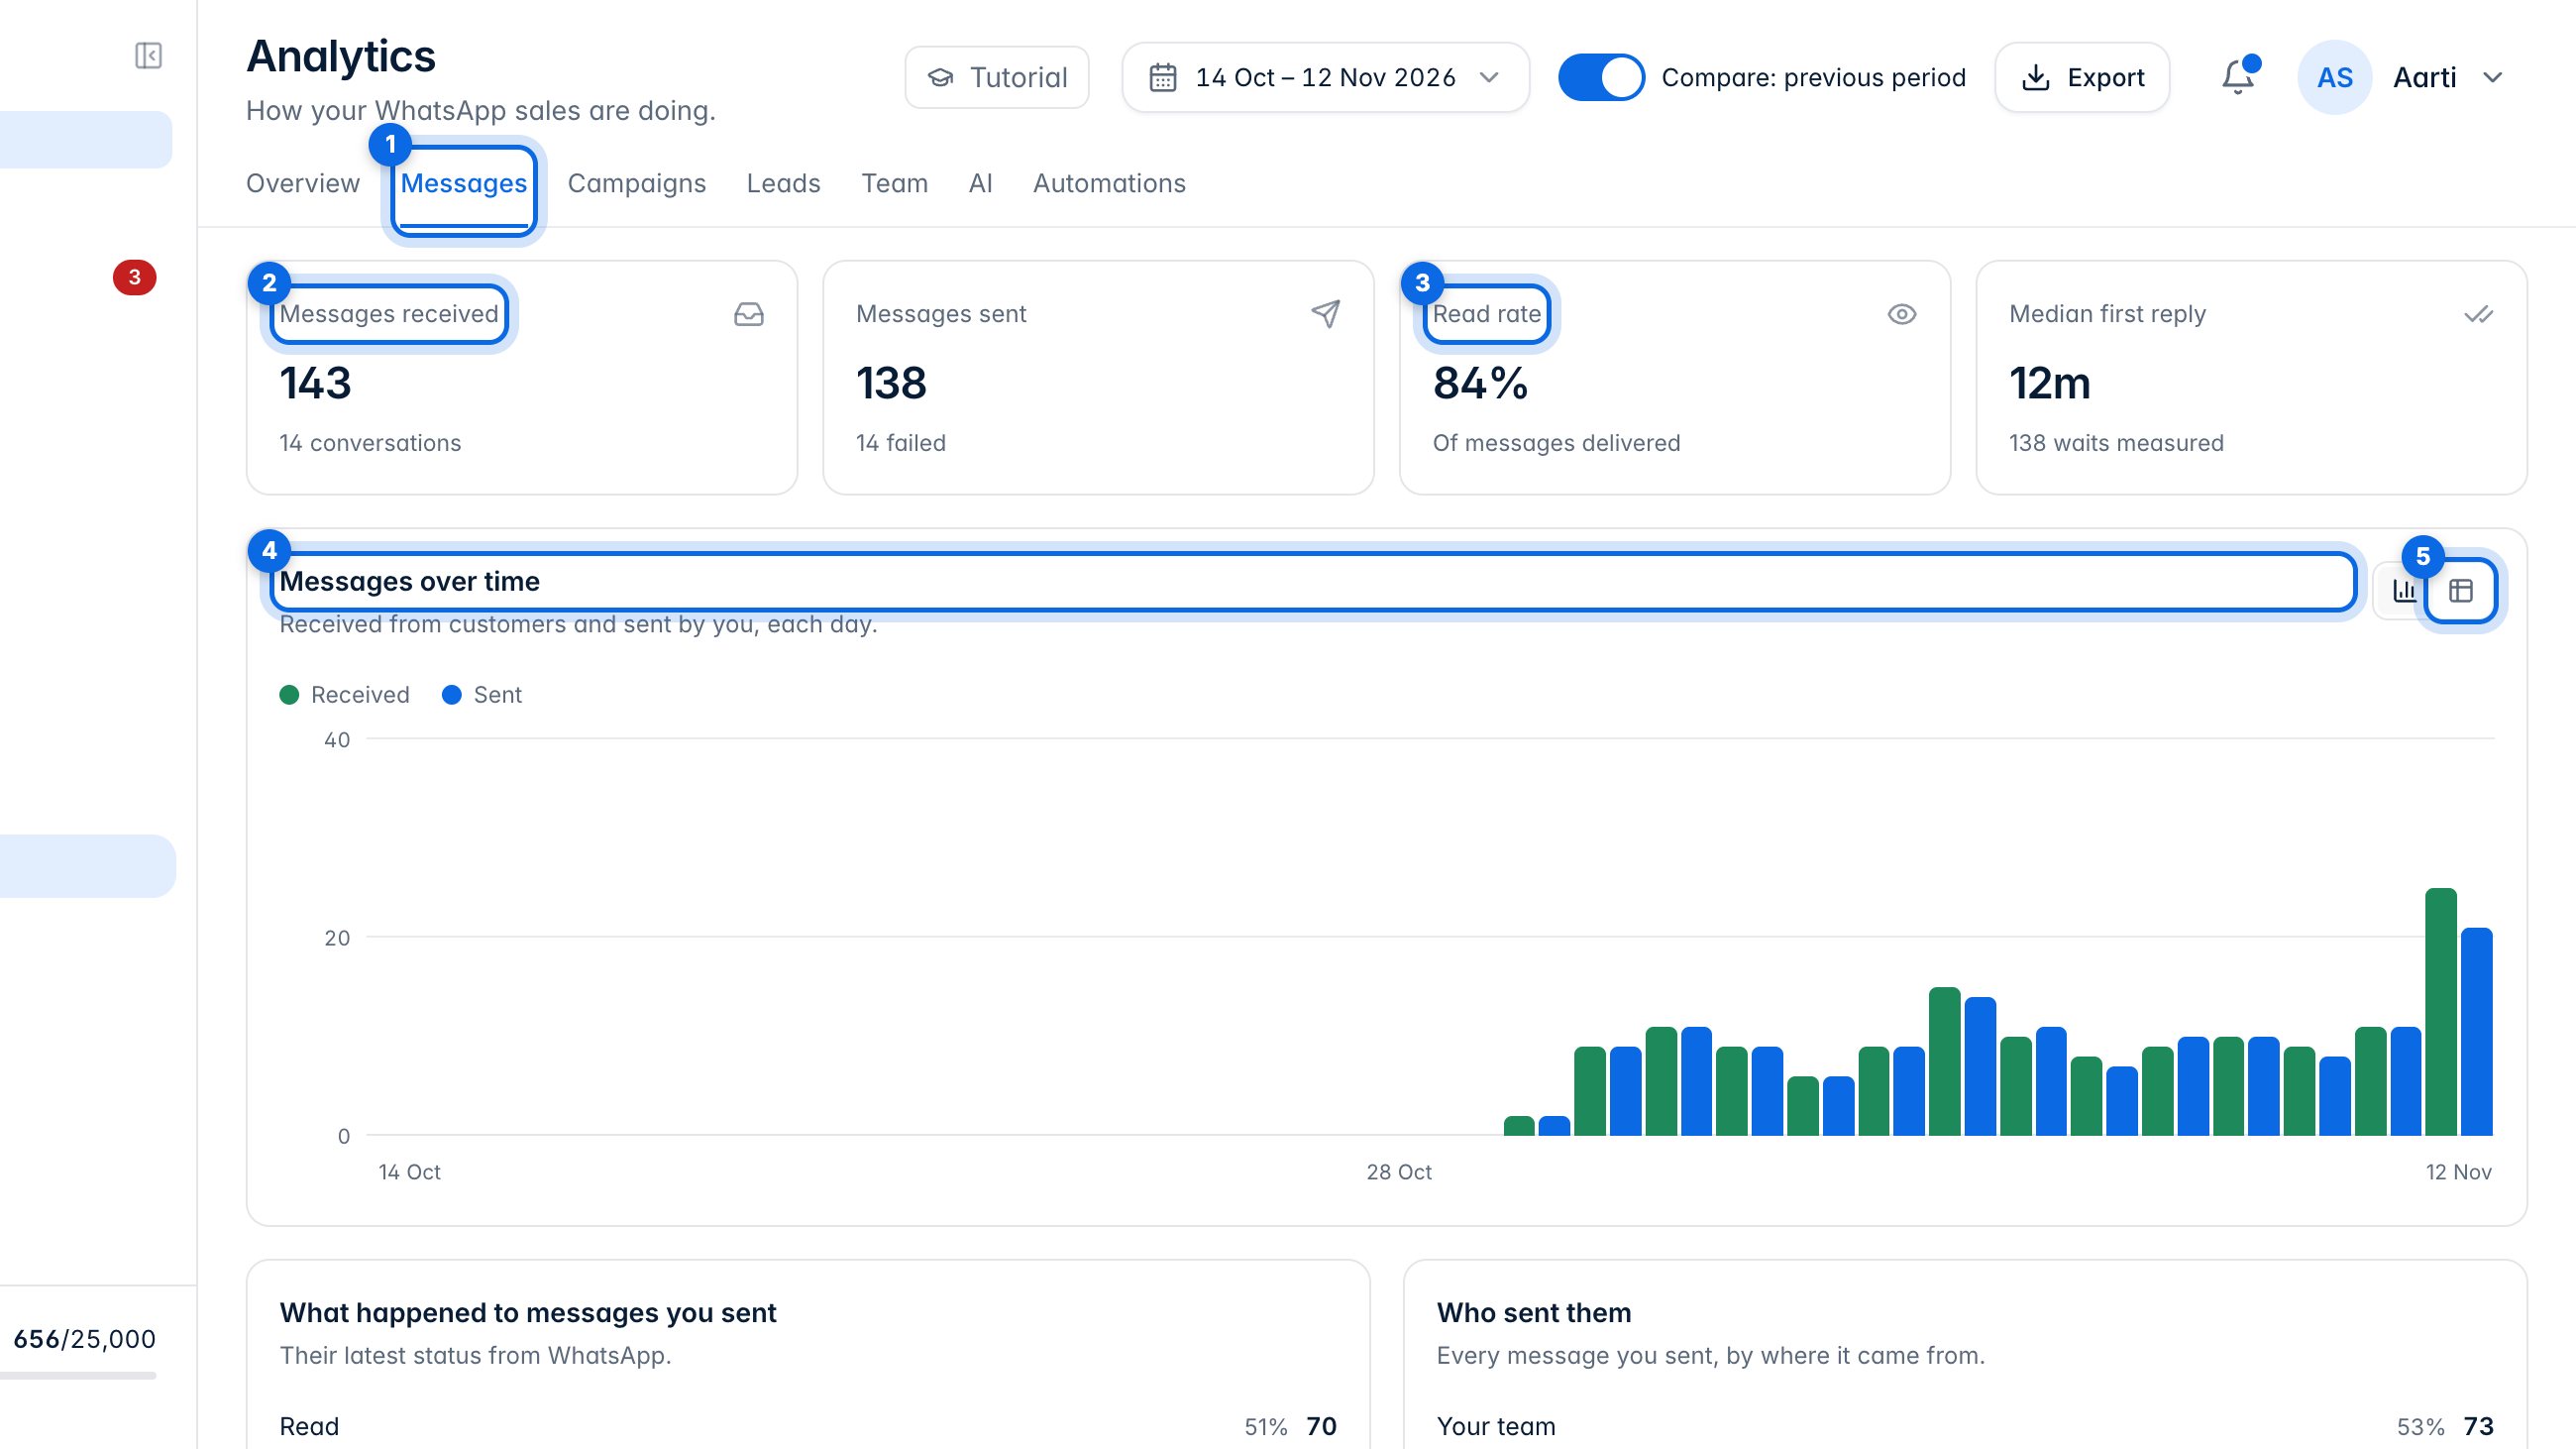
3. Messages
Messages (1) counts what customers sent you (2) and how much of yours was read (3). The chart (4) shows each day; the table button (5) shows the same numbers as a table. Further down: what happened to every message you sent, and who sent them.
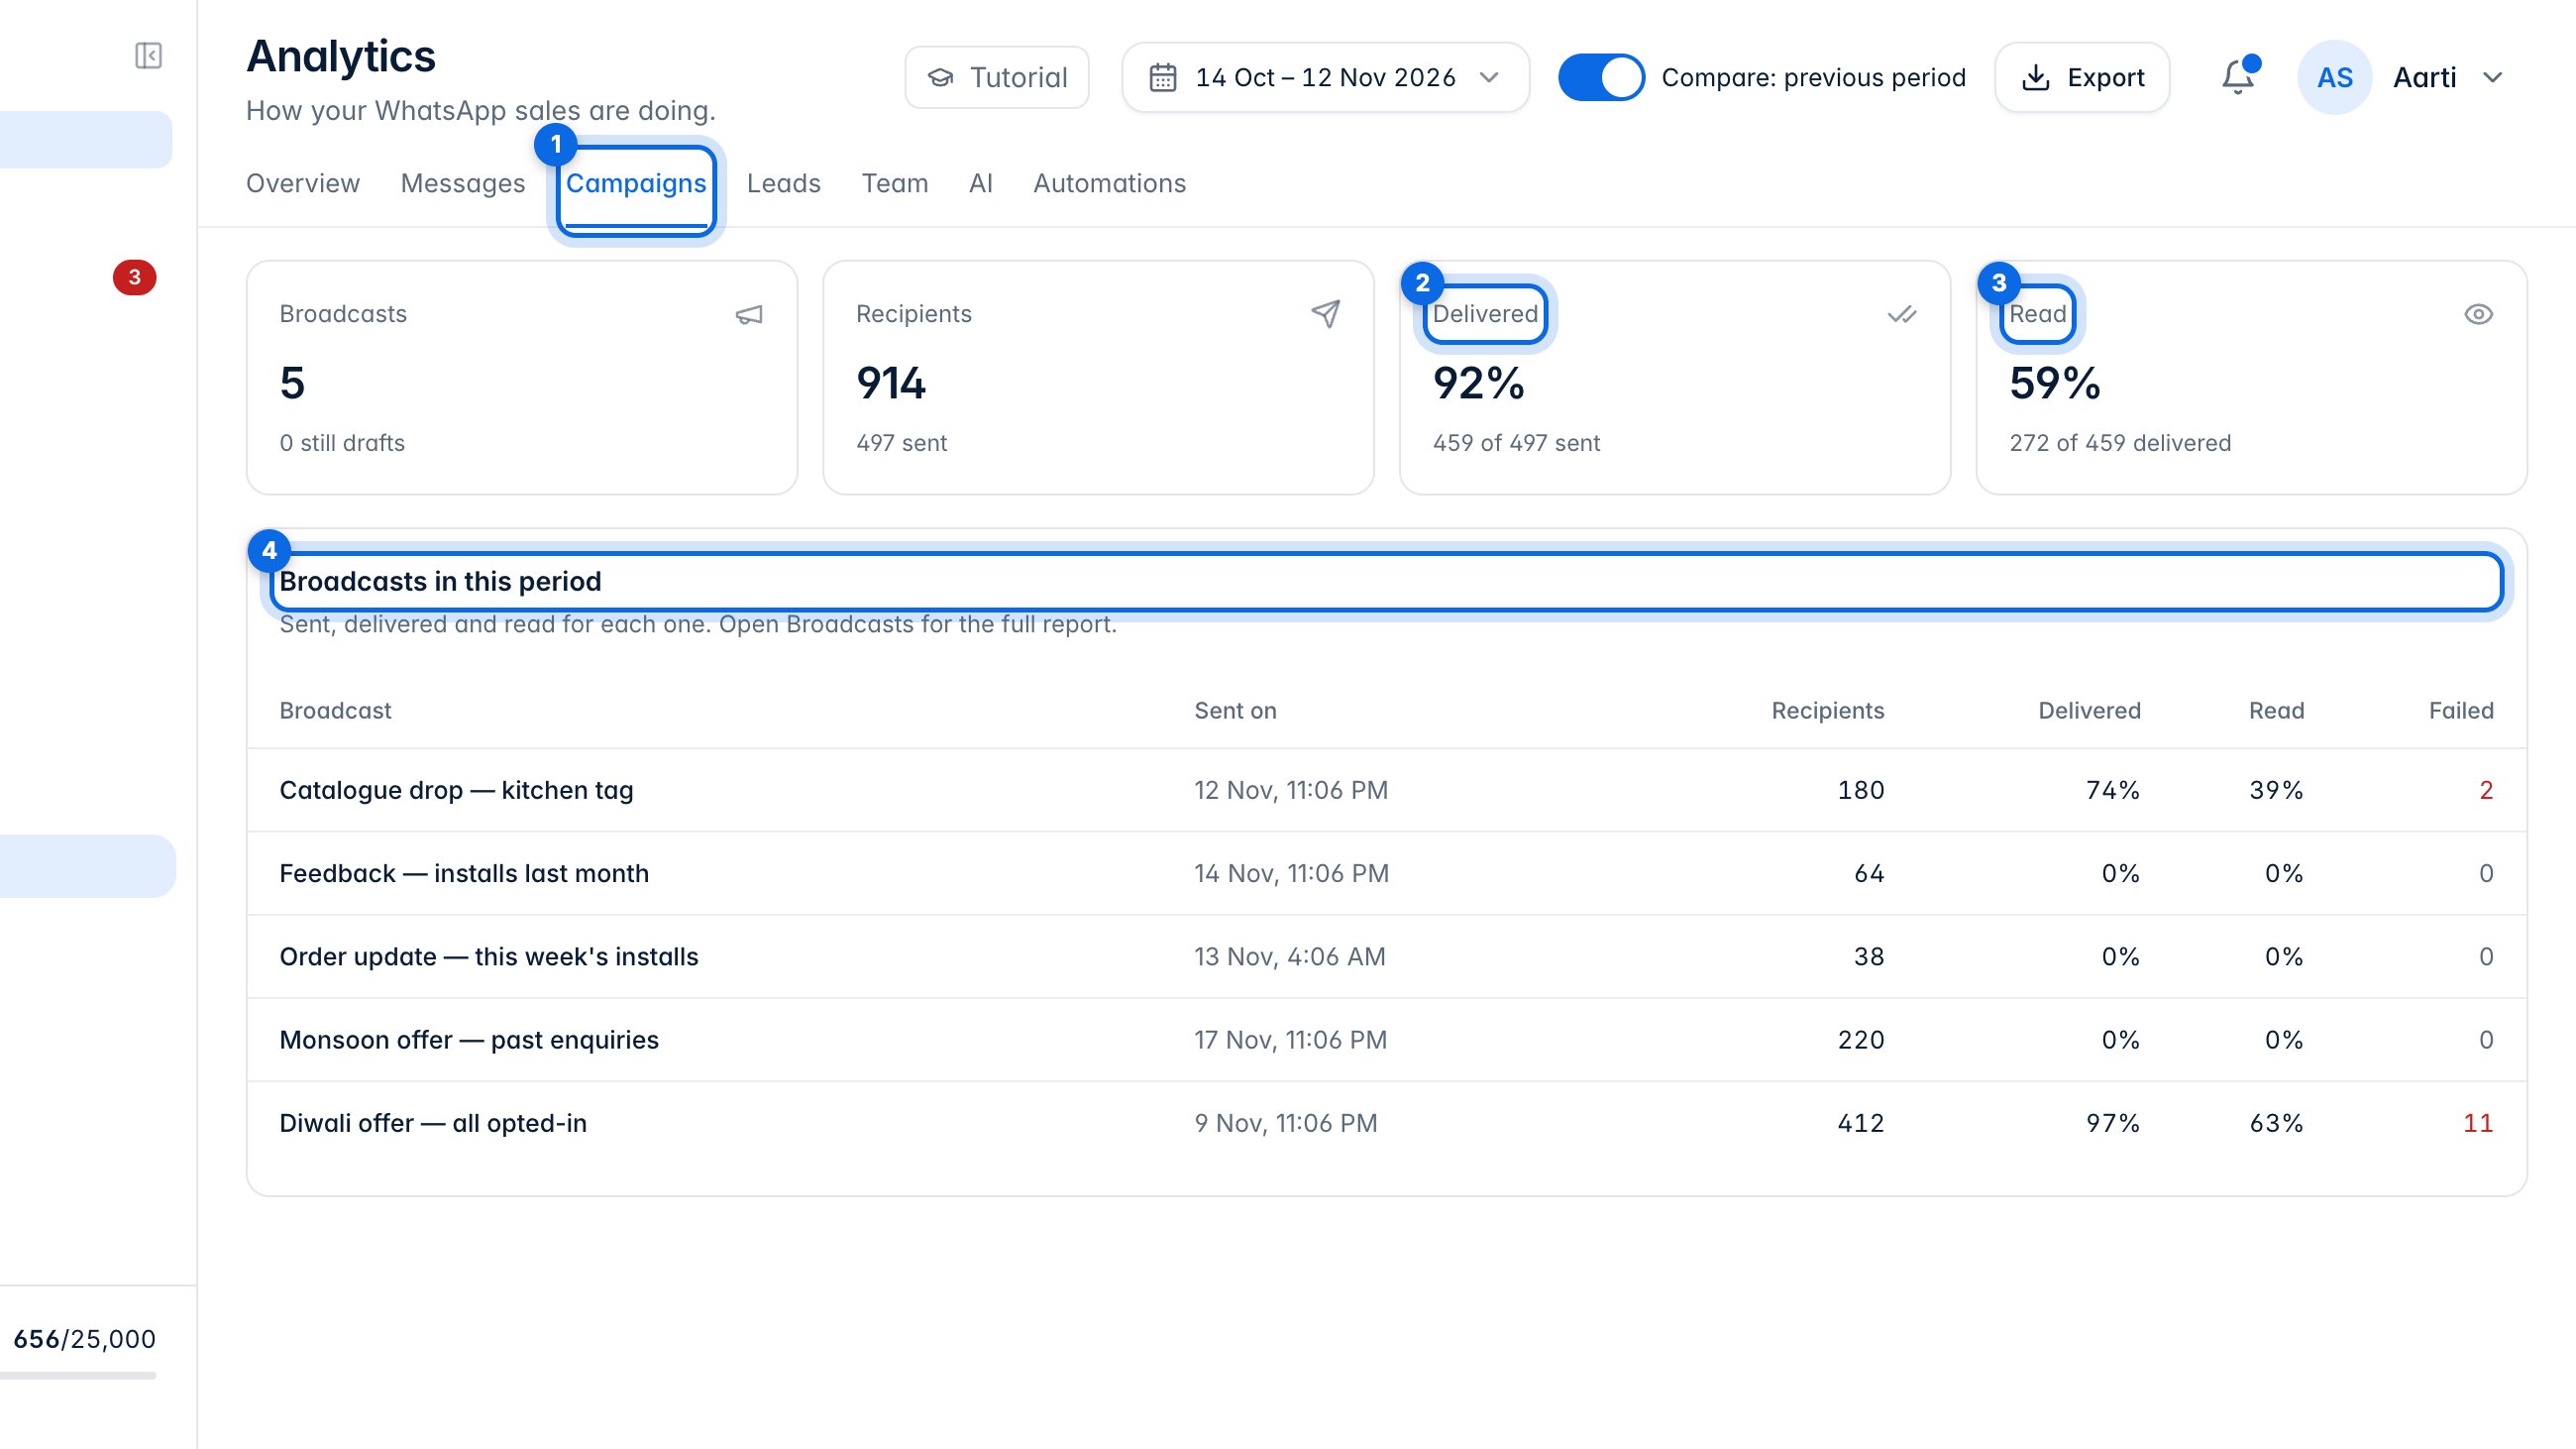
4. Campaigns
Campaigns (1) shows how your broadcasts did: how many were delivered (2) and read (3), and a row for each broadcast in the period (4). Open Broadcasts for the full report of any one.
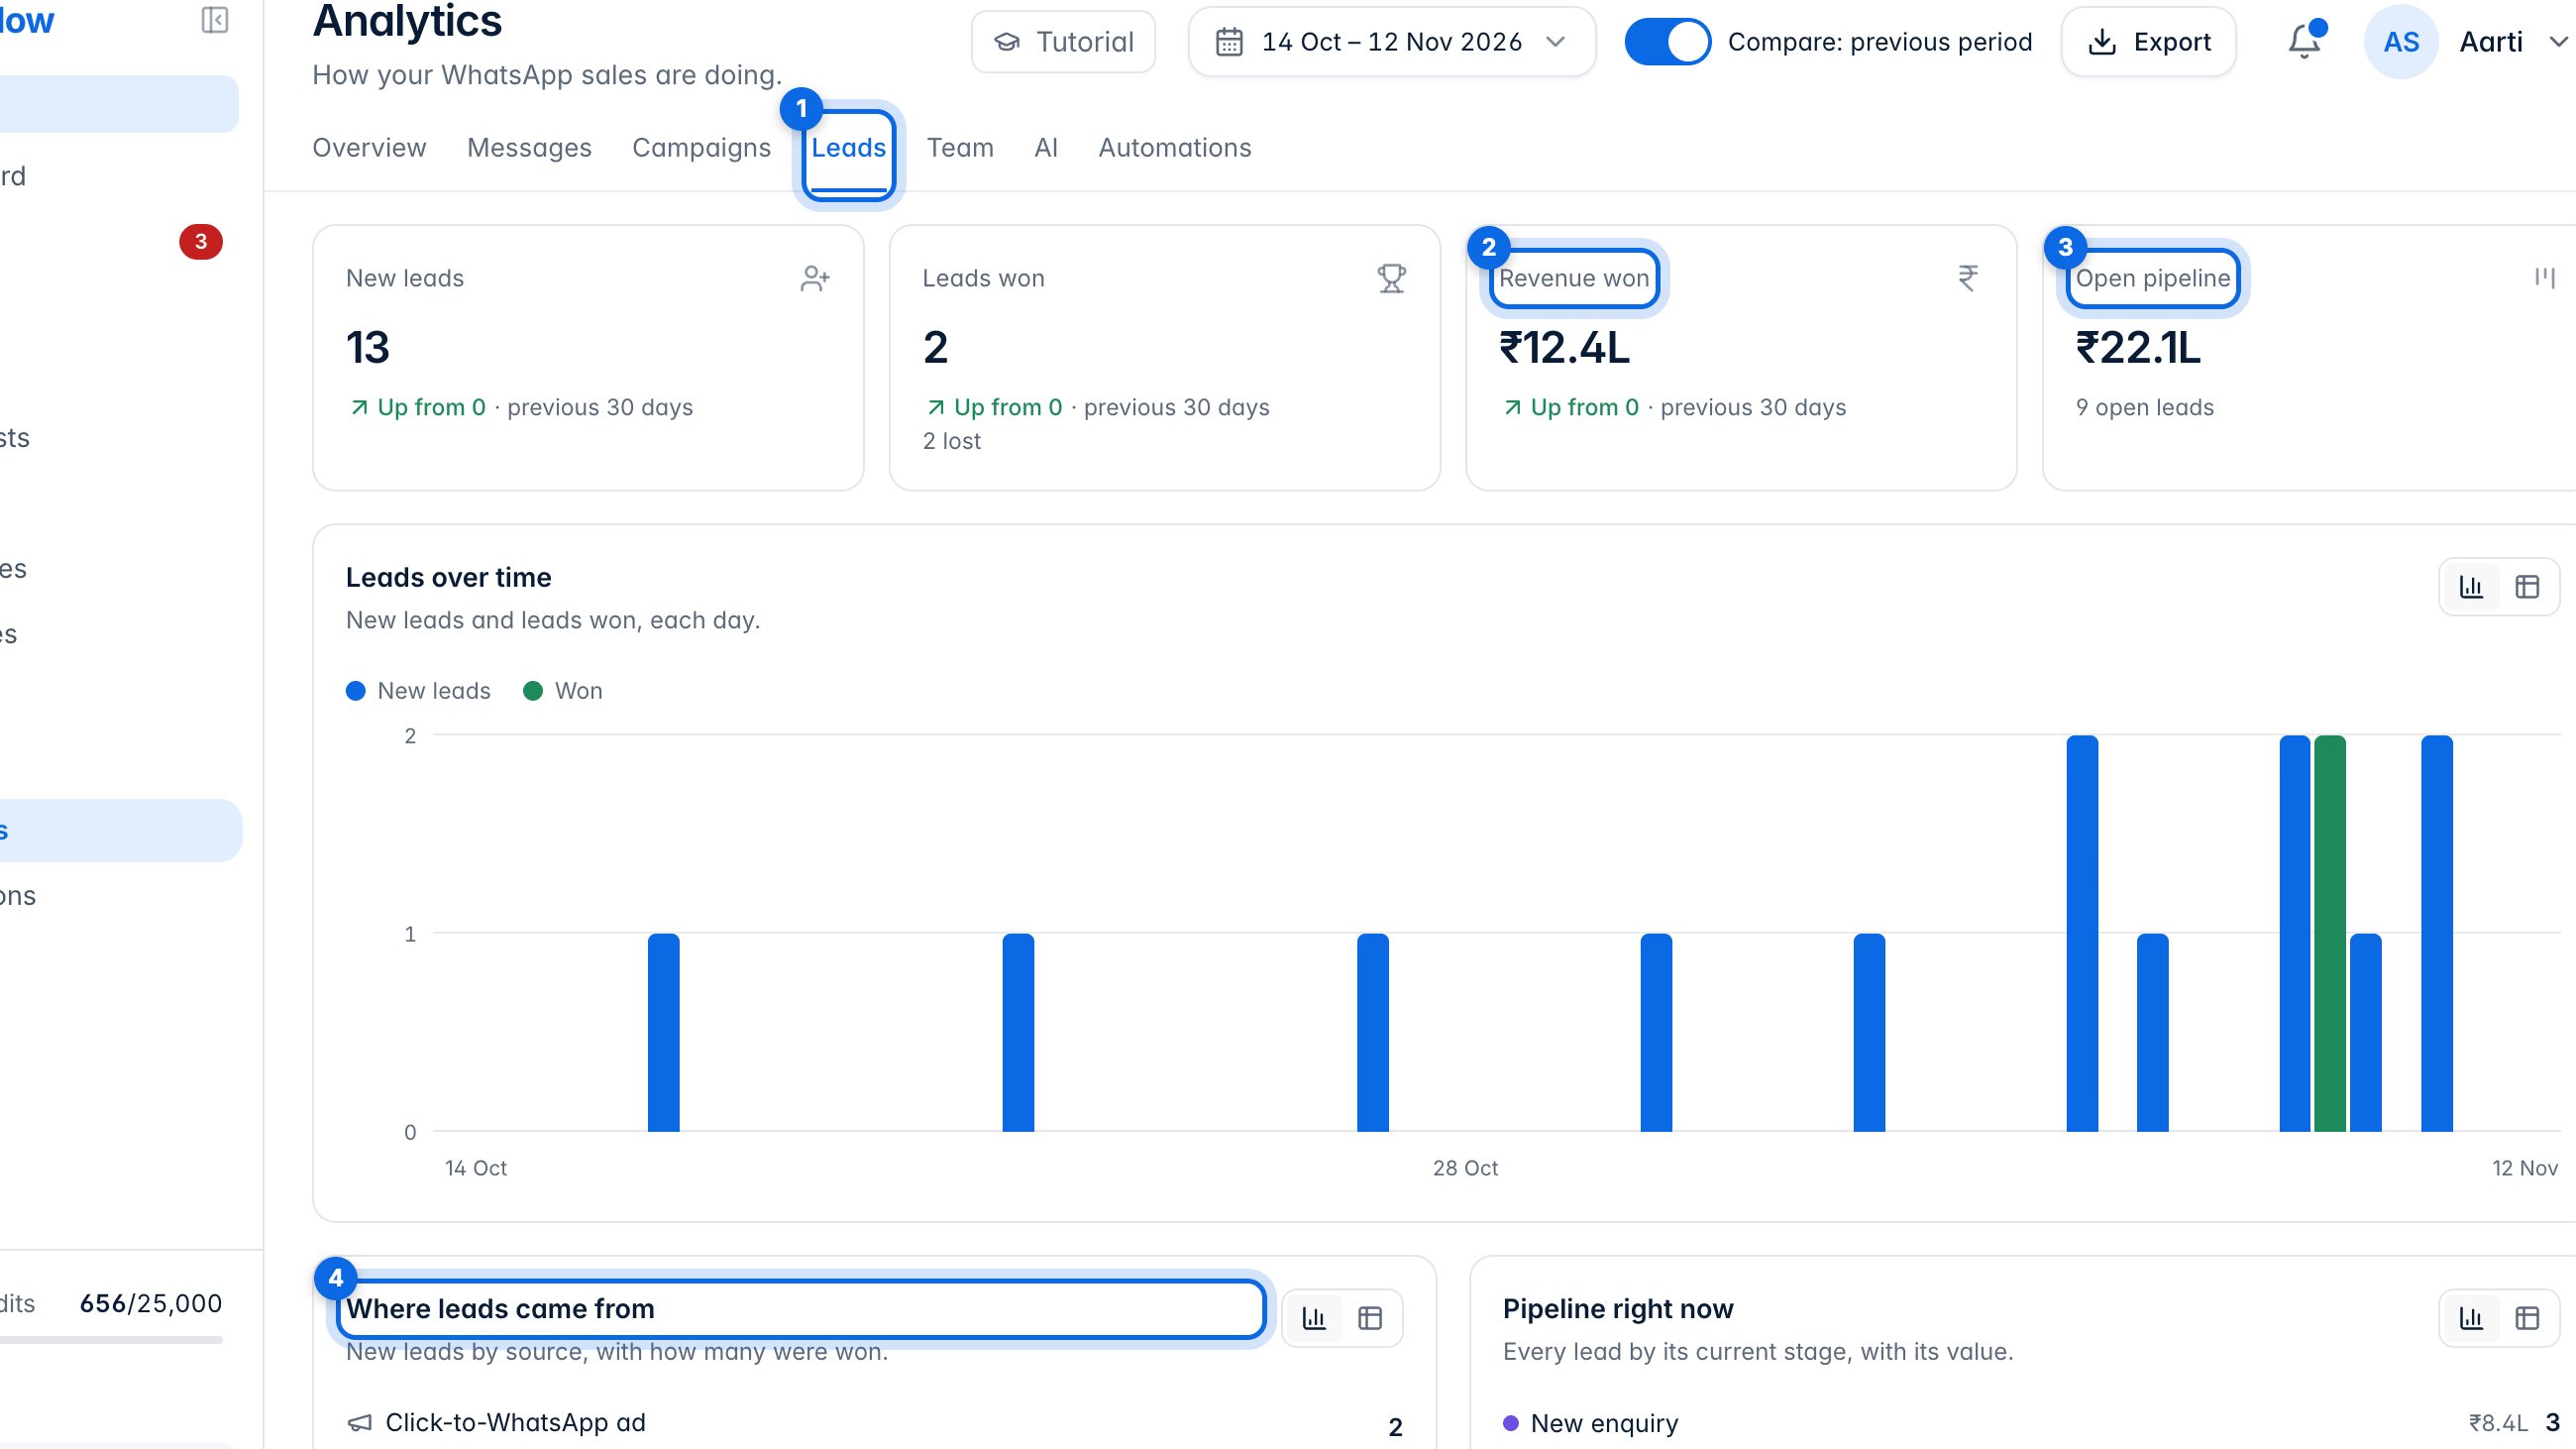
5. Leads
Leads (1) shows revenue won (2), the value of your open pipeline (3), and which sources bring leads and how many of them were won (4).
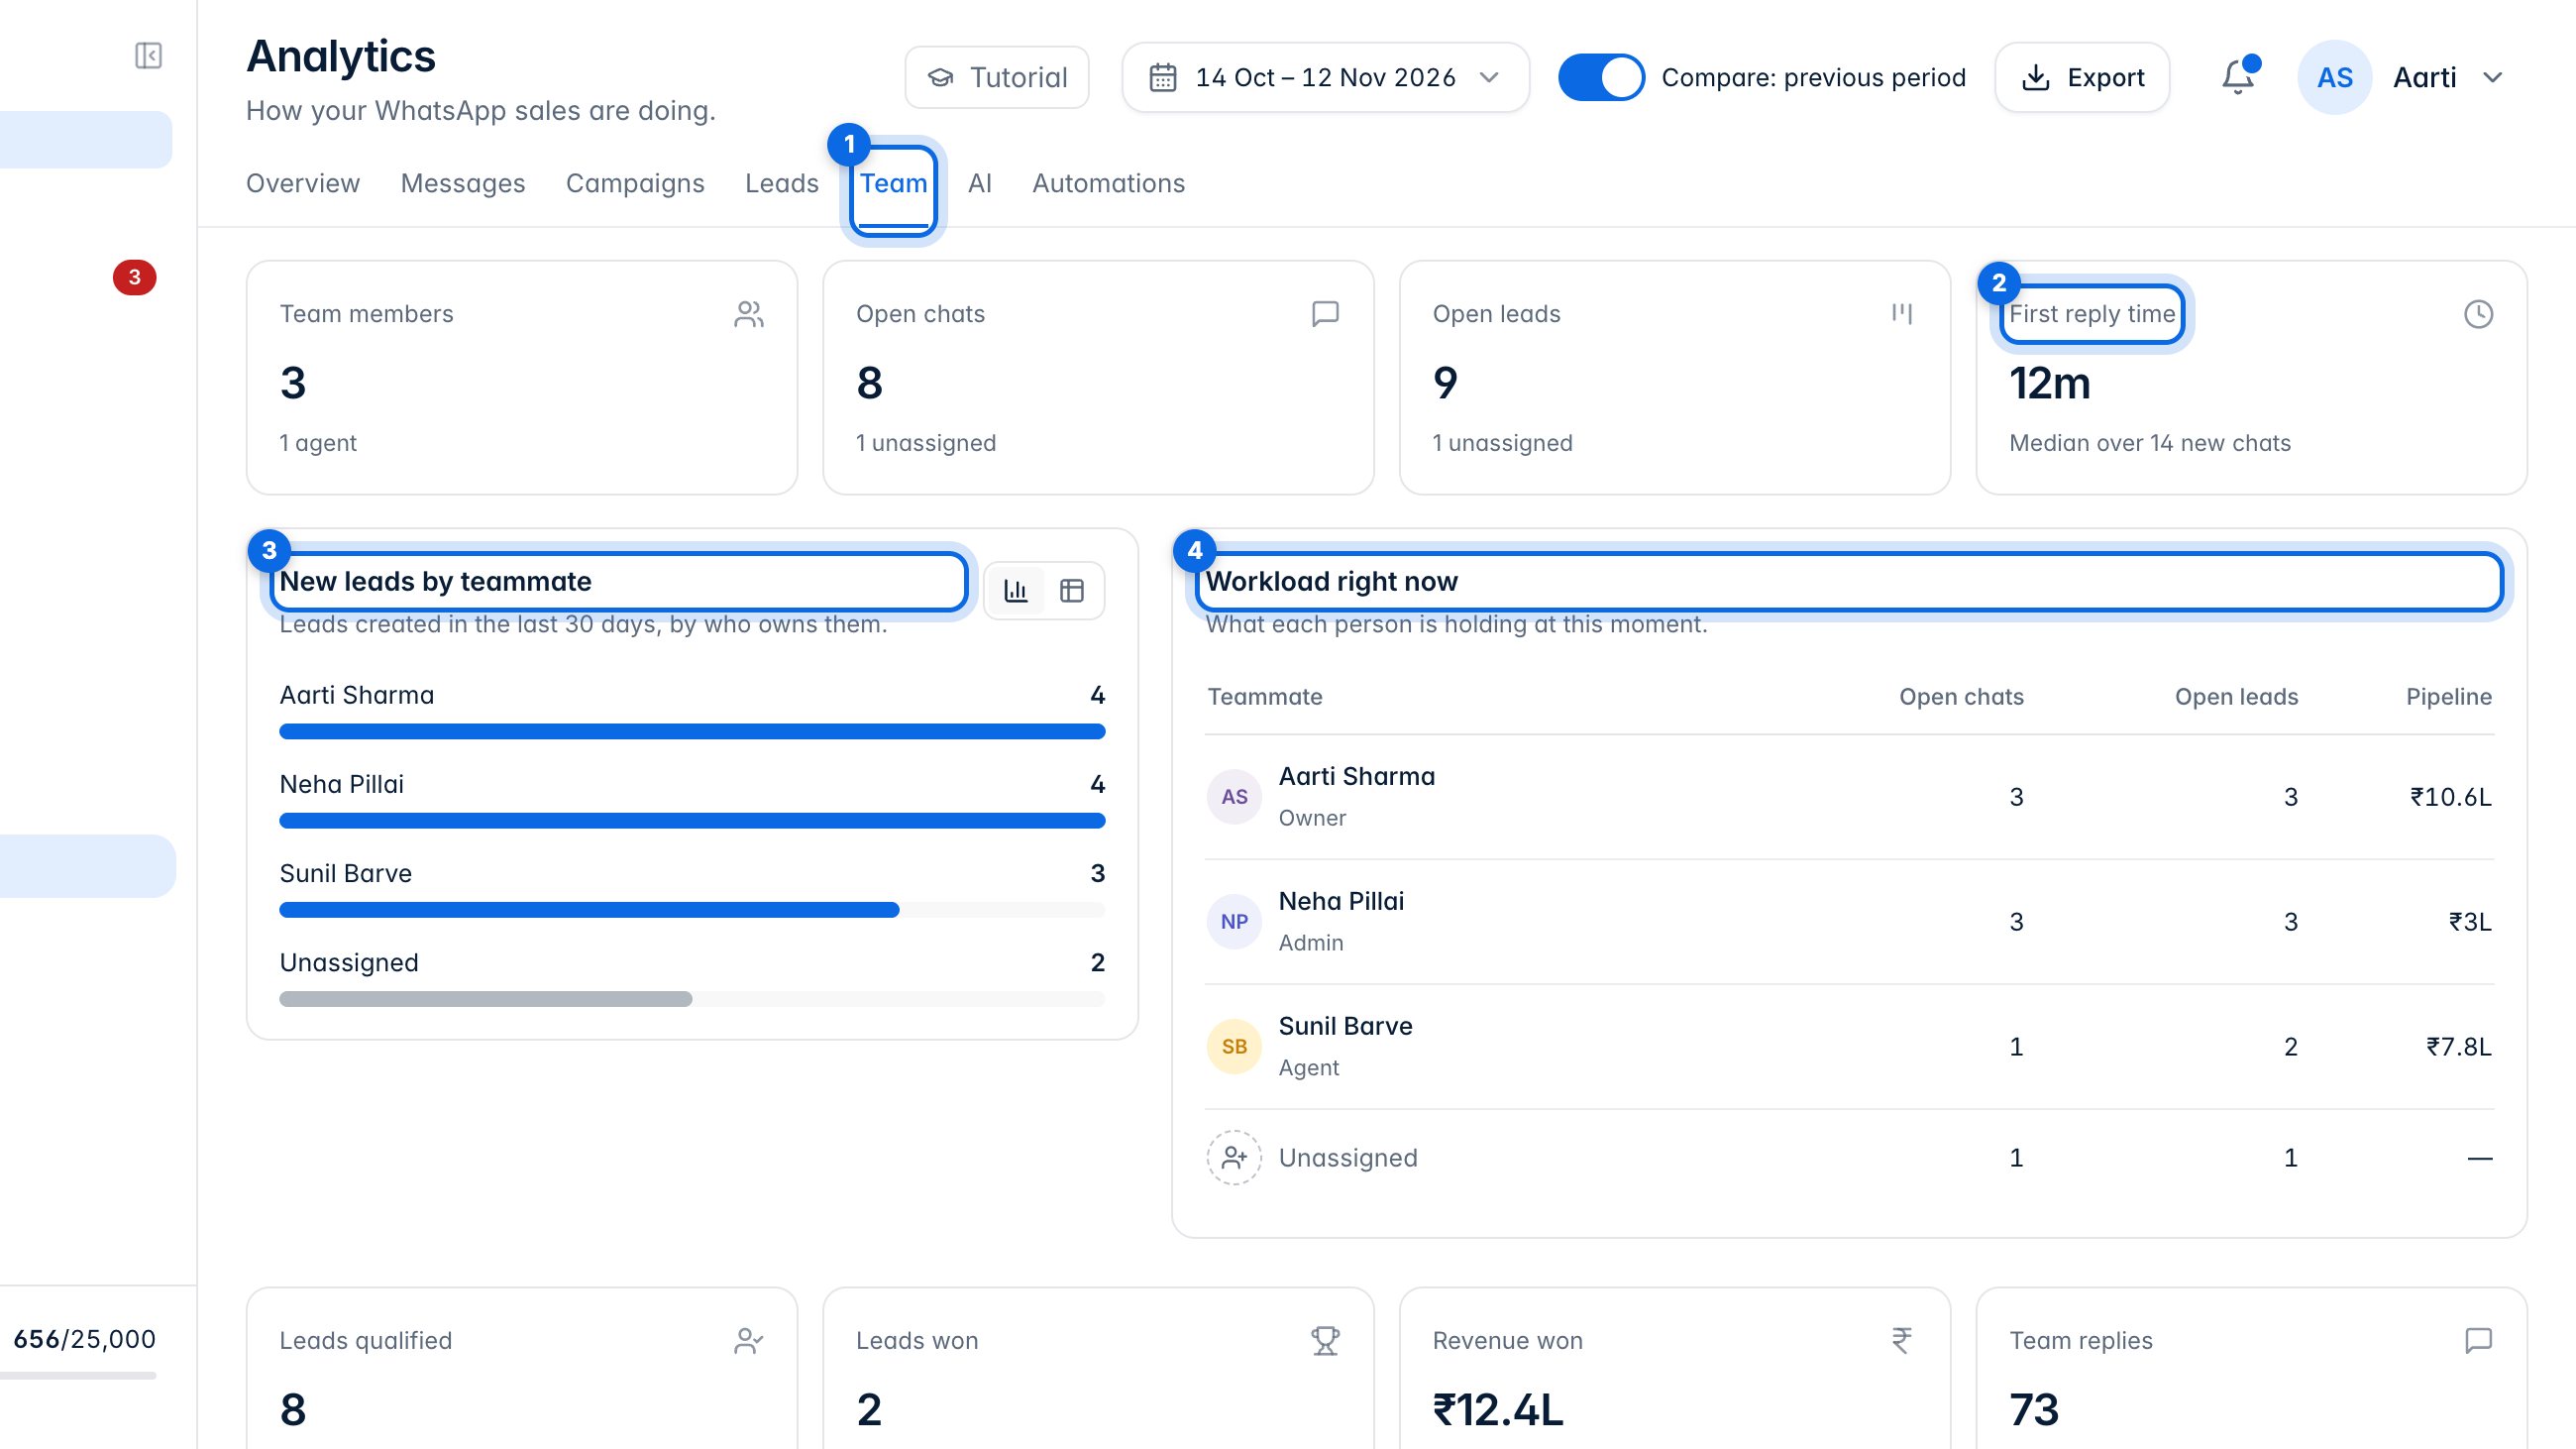
6. Team
Team (1) shows your first reply time (2), the new leads each teammate owns (3), and what everyone is holding right now (4).
7. AI and automations
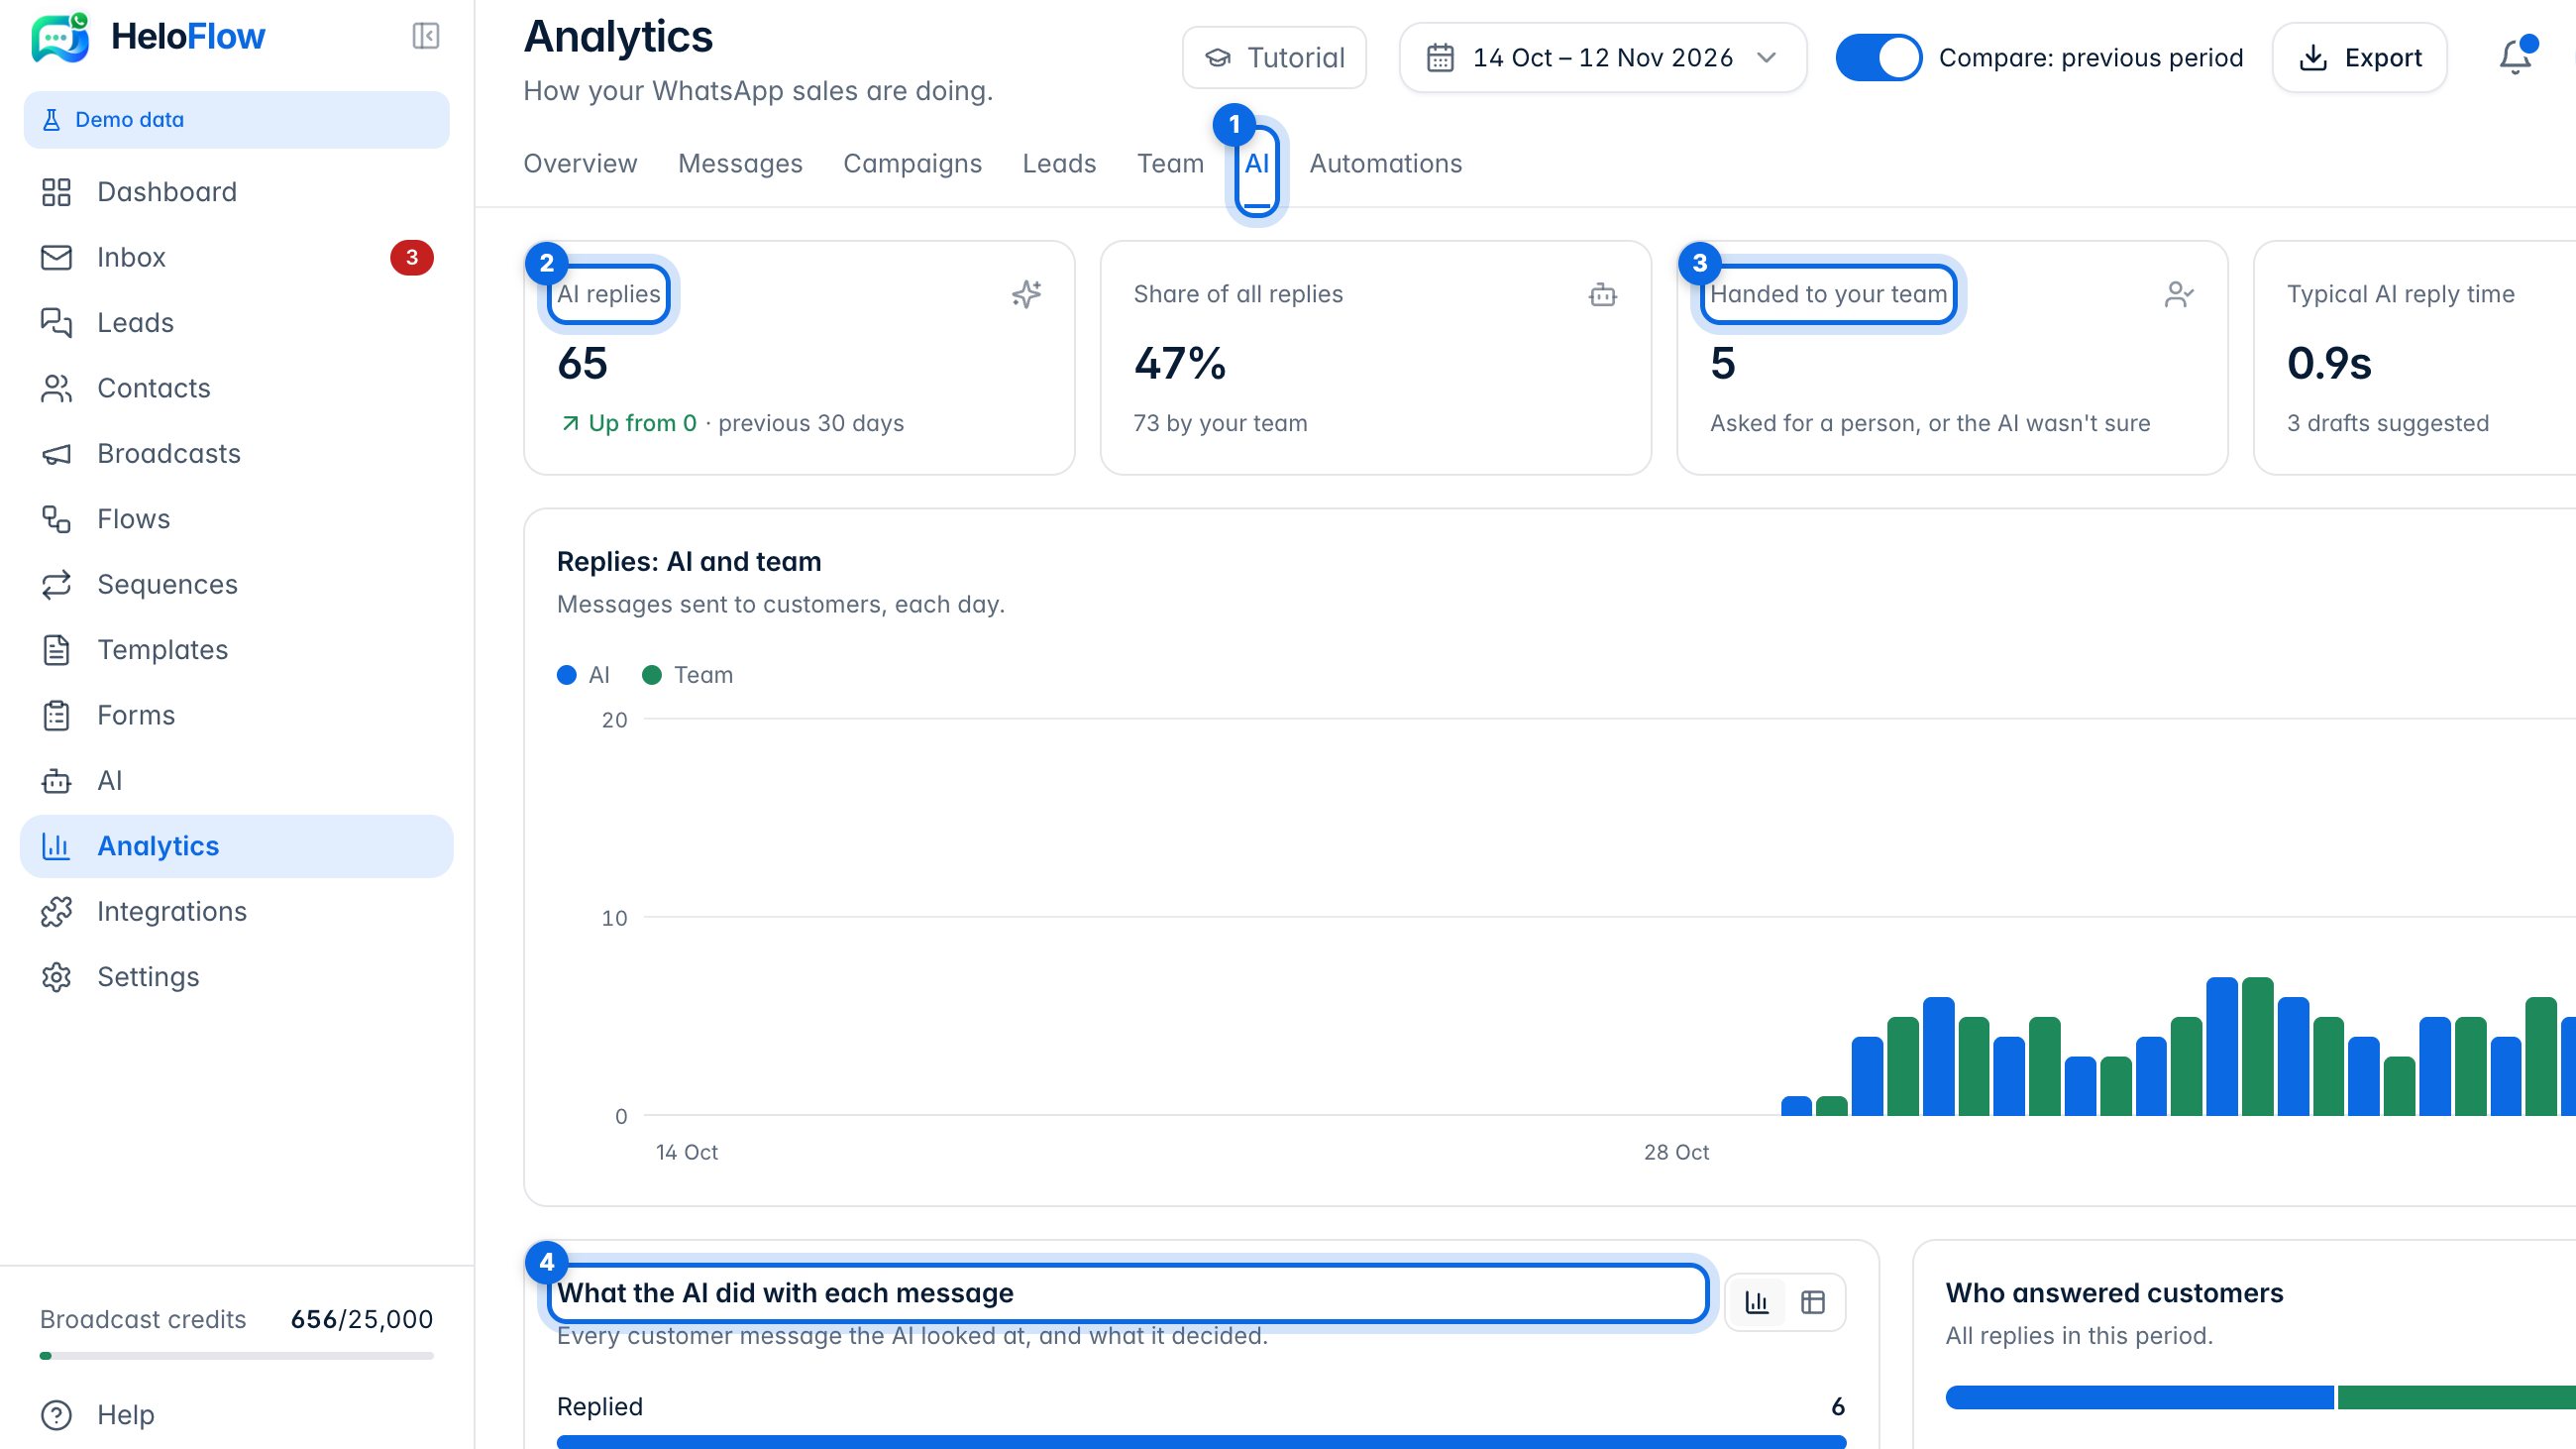
AI (1) shows how many replies the assistant sent (2), how many chats it handed to your team (3), and what it did with each message (4).
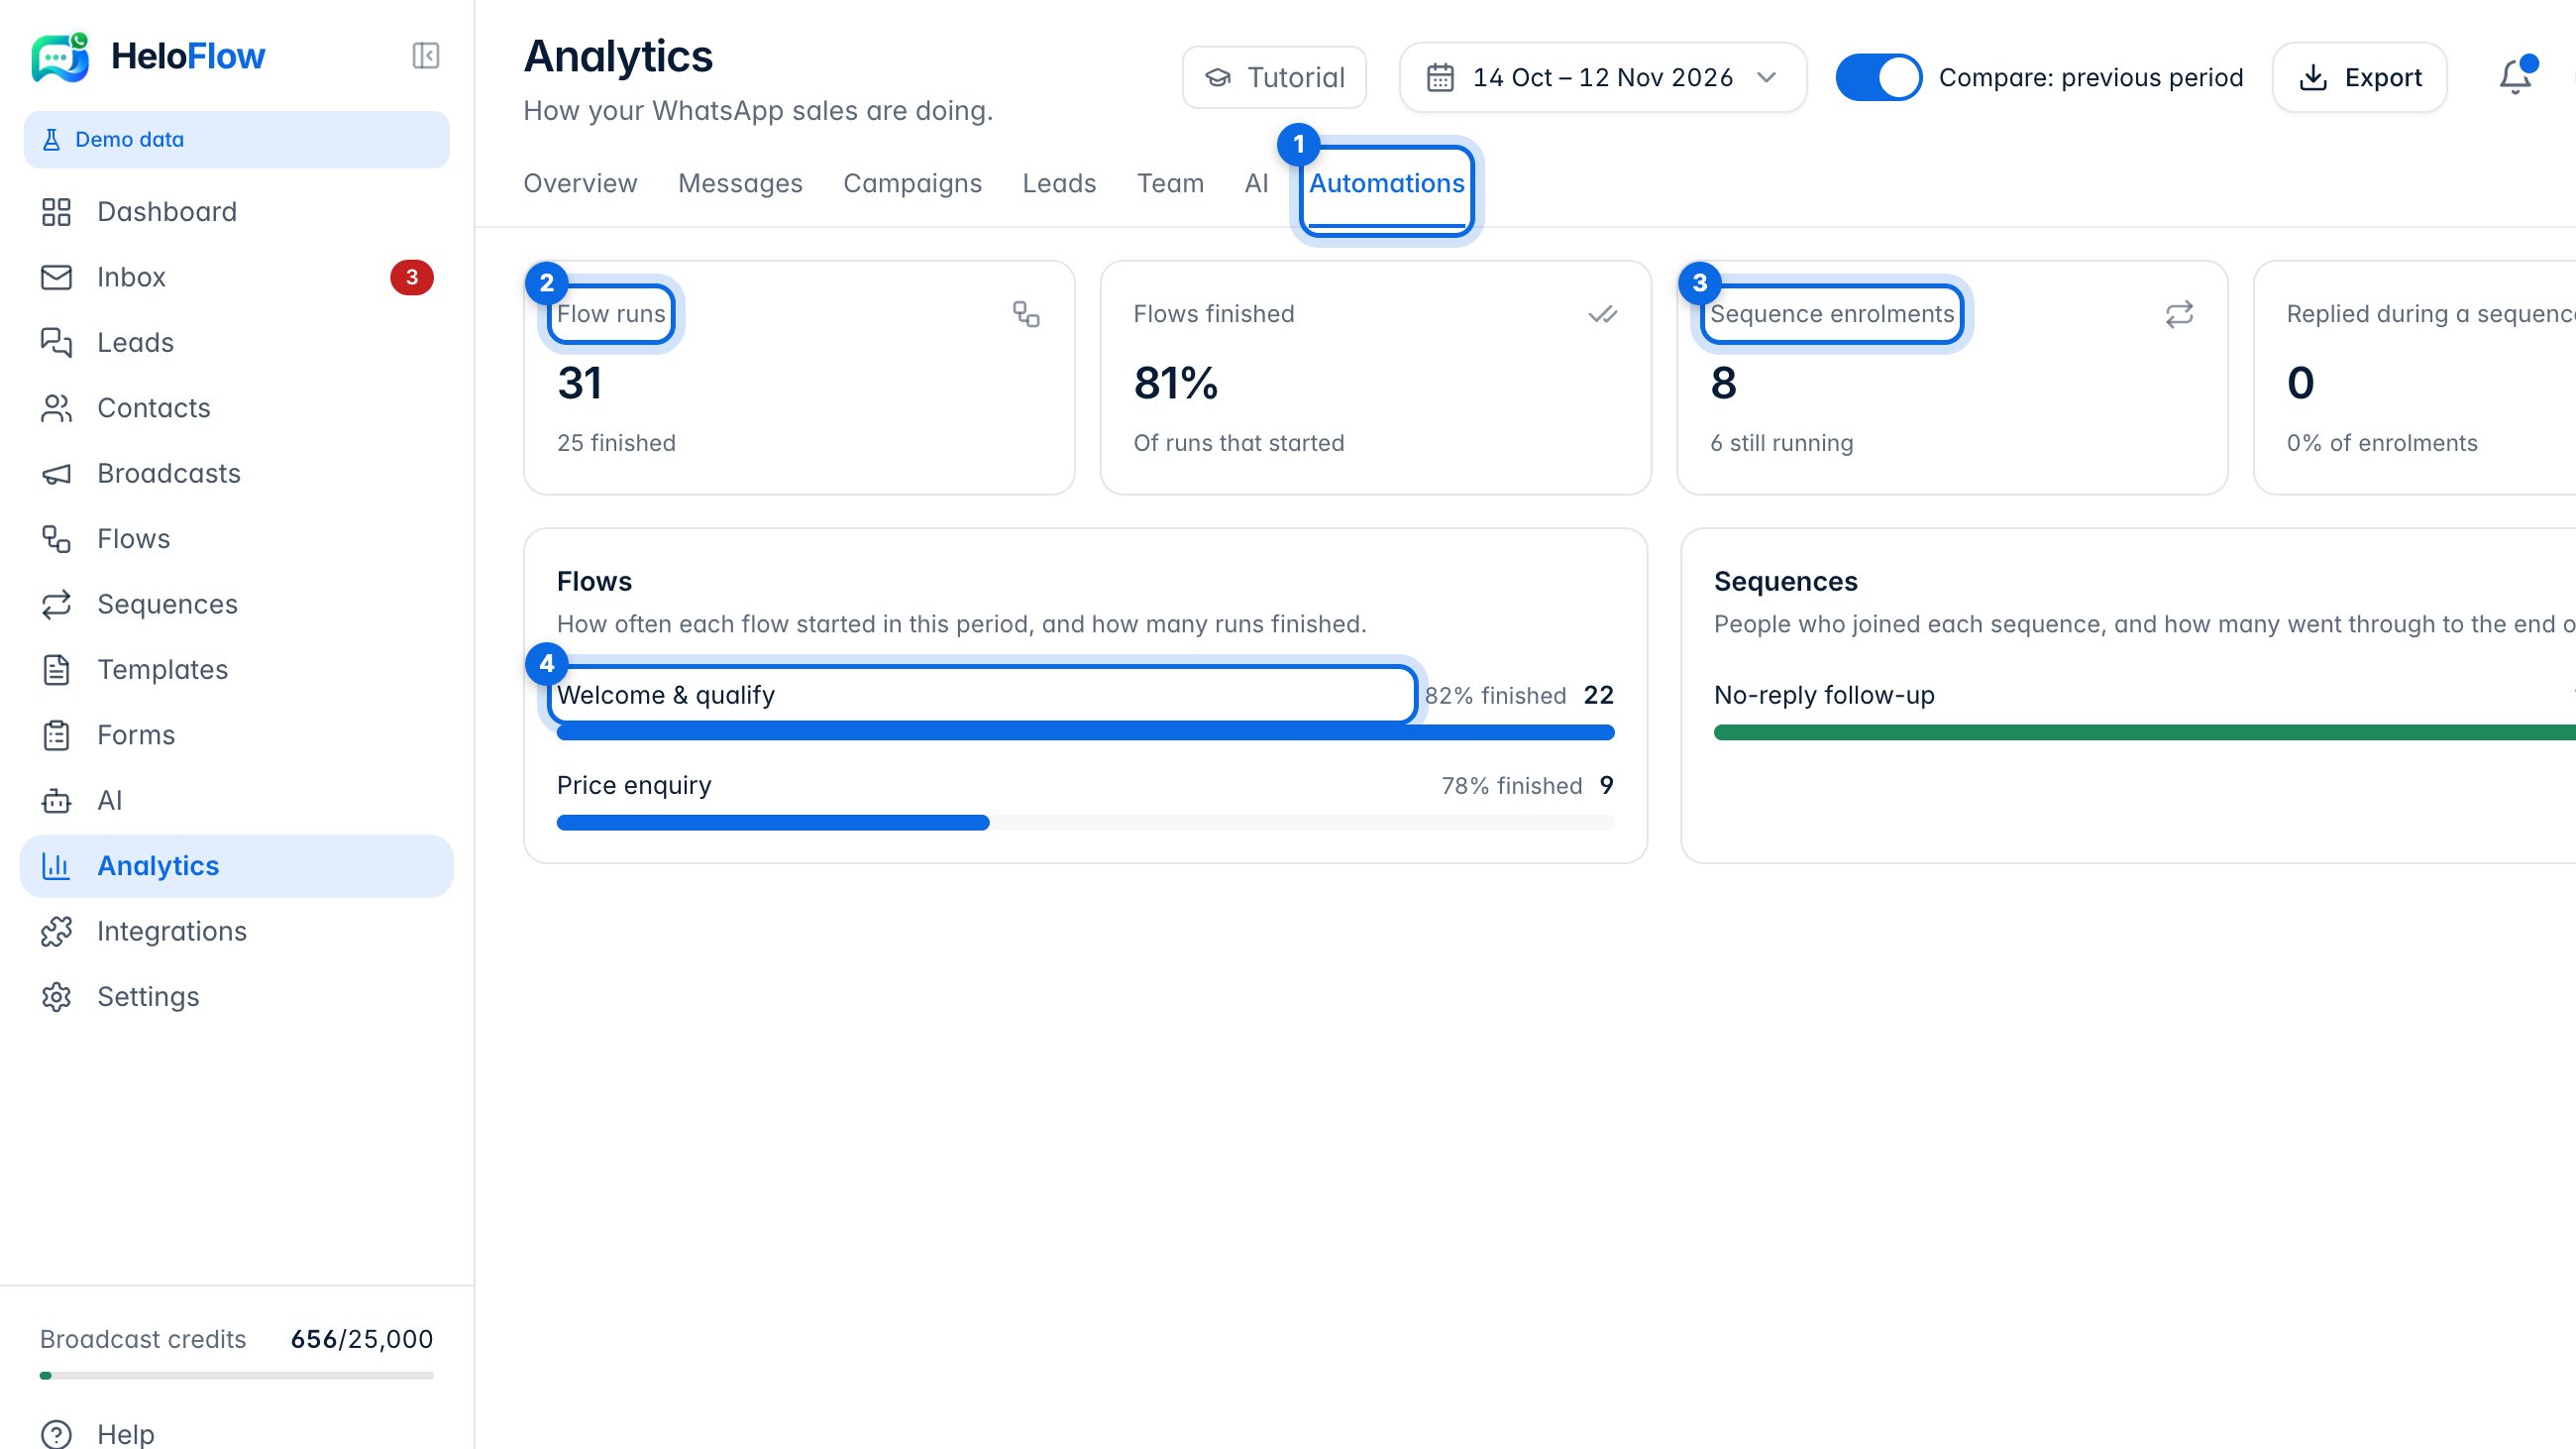
Automations (1) shows how often your flows ran (2), how many people joined your sequences (3), and how each flow is doing (4).